Health Tracker
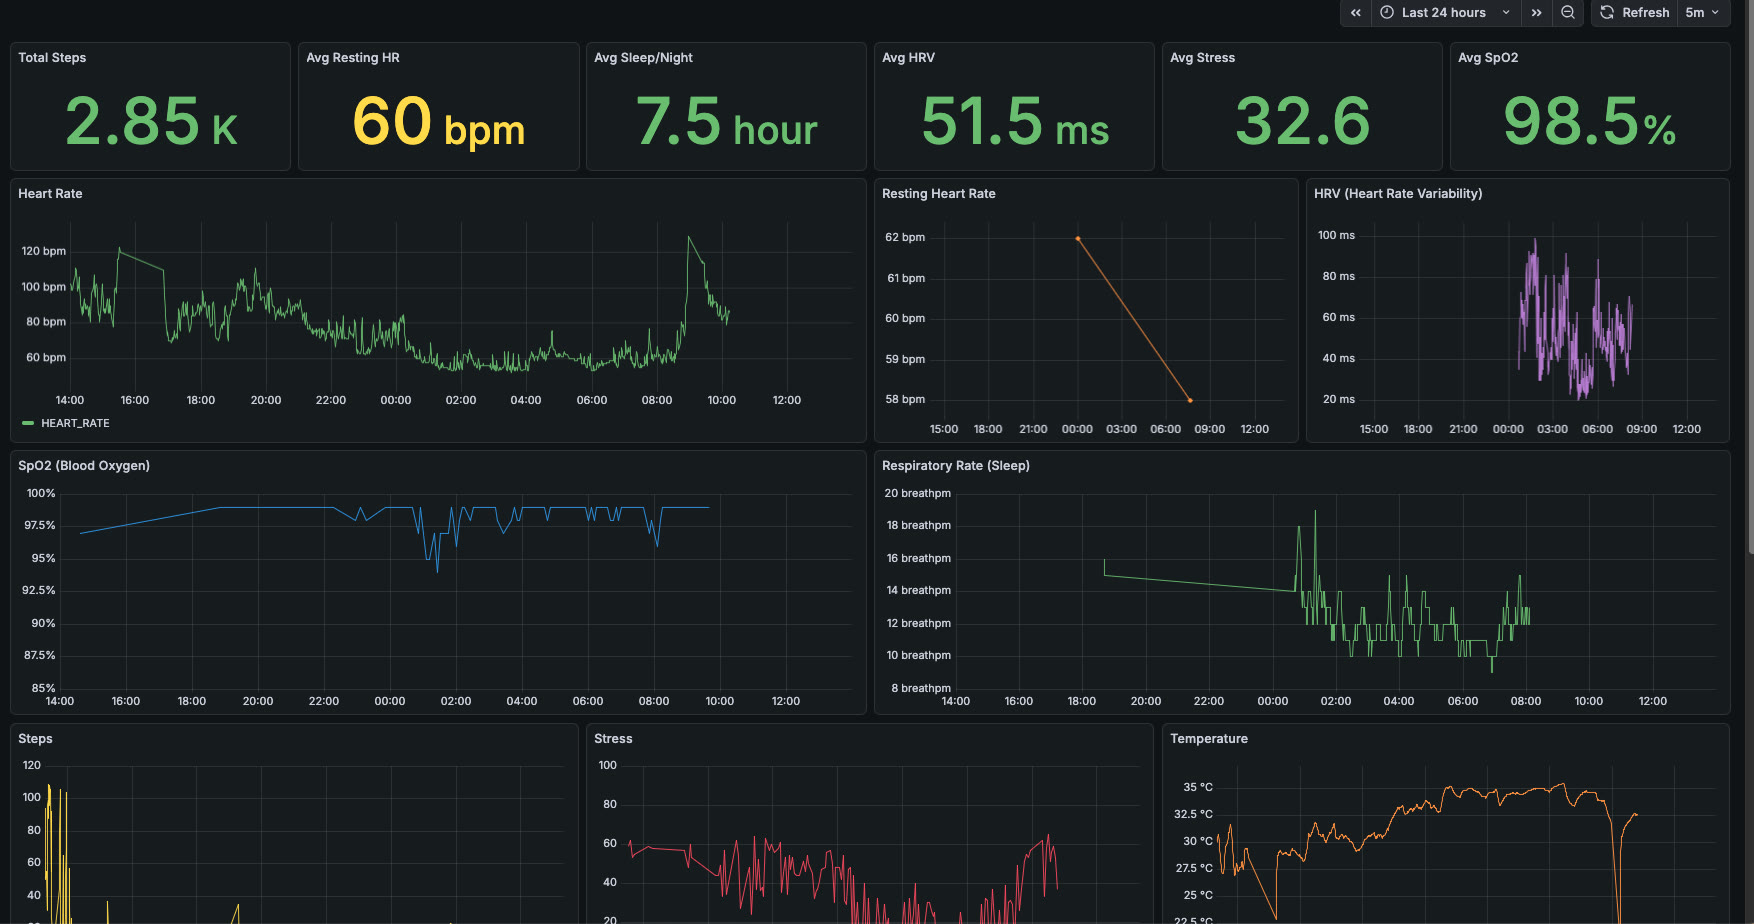
Health Tracker is a Grafana dashboard for the data from an Amazfit Helio Strap. The strap syncs to the open-source Gadgetbridge app on an Android phone, the app’s database is copied to a Mac, and Grafana reads it directly. The dashboard shows heart rate, resting heart rate, HRV, blood oxygen, breathing rate, stress, steps, temperature and sleep. It is a personal setup and is not published as a package.
How the data gets to Grafana
- The Helio Strap syncs to Gadgetbridge on the phone, which keeps every reading in a SQLite database.
- Syncthing copies the Gadgetbridge database from the phone to a folder on the Mac.
- Every 30 minutes a launchd job copies that file into Grafana’s data folder with SQLite’s
.backupcommand. - Grafana runs in Docker and reads the copy through the SQLite data source plugin (
frser-sqlite-datasource). Each panel is a SQL query against Gadgetbridge’s own tables.
The dashboard opens on the last 24 hours and refreshes every 5 minutes. A small alerter checks the newest sample once an hour and sends a push notification through ntfy if nothing new has arrived for 48 hours, and another when data starts arriving again.
Averages for the selected period
The top row has six numbers for whatever time range is selected: total steps, average resting heart rate, average sleep per night, average HRV, average stress and average SpO2. Each is coloured green, yellow or red by a threshold:
- Resting heart rate: green below 60 bpm, yellow from 60, red from 75.
- Sleep per night: red below 5 hours, yellow from 5, green from 7.
- HRV: red below 30 ms, yellow from 30, green from 50.
- Stress: green below 40, yellow from 40, red from 60.
- SpO2: red below 90%, yellow from 90%, green from 95%.
Sleep per night counts the minutes the strap marked as sleep and divides them by the number of days in the range.
Charts over time
Below the numbers are line charts of heart rate, resting heart rate, HRV, SpO2, breathing rate during sleep, steps per minute, stress, temperature, the PAI score (today’s and the running total) and the strap’s battery level.
Gadgetbridge stores a code for each minute in the RAW_KIND column of the activity table, and
the low four bits say what the strap was doing: 3 means it was not being worn and 6 means it was charging.
The heart rate, HRV, SpO2, stress and temperature queries drop readings from those minutes, so the charts
don’t show values from a strap sitting on a desk or on its charger. The heart rate query also drops 0 and
255, which the strap records when it has no reading.
Device Status is a timeline that shows each minute as Worn (green), Not Worn (red) or Charging (orange), using the same code.
Sleep
The Sleep panel is a timeline with each minute the strap marked as sleep (code 8) shown in dark blue. The other sleep panels work in nights. A night is a run of sleep minutes with no gap longer than an hour, and it has to add up to at least 3 hours, so naps are left out. For each night the queries take the first sleep minute as bedtime, the last as wake-up, and the gaps in between as time awake in bed.
- Bedtime & wake-up over time plots both times for every night.
- Time asleep per night has a stacked bar for each night, hours asleep and hours awake in bed, with a 28-night average line and a dashed line at 7 hours.
- Avg time asleep by month is a bar chart with the average for each month and the number of nights counted.
- Sleep log is a table with one row per night, newest first: the date, day of the week, bedtime, wake-up, time asleep, time in bed and time awake in bed.
More self-hosted
All self-hosted →