Internet Speed Tracker
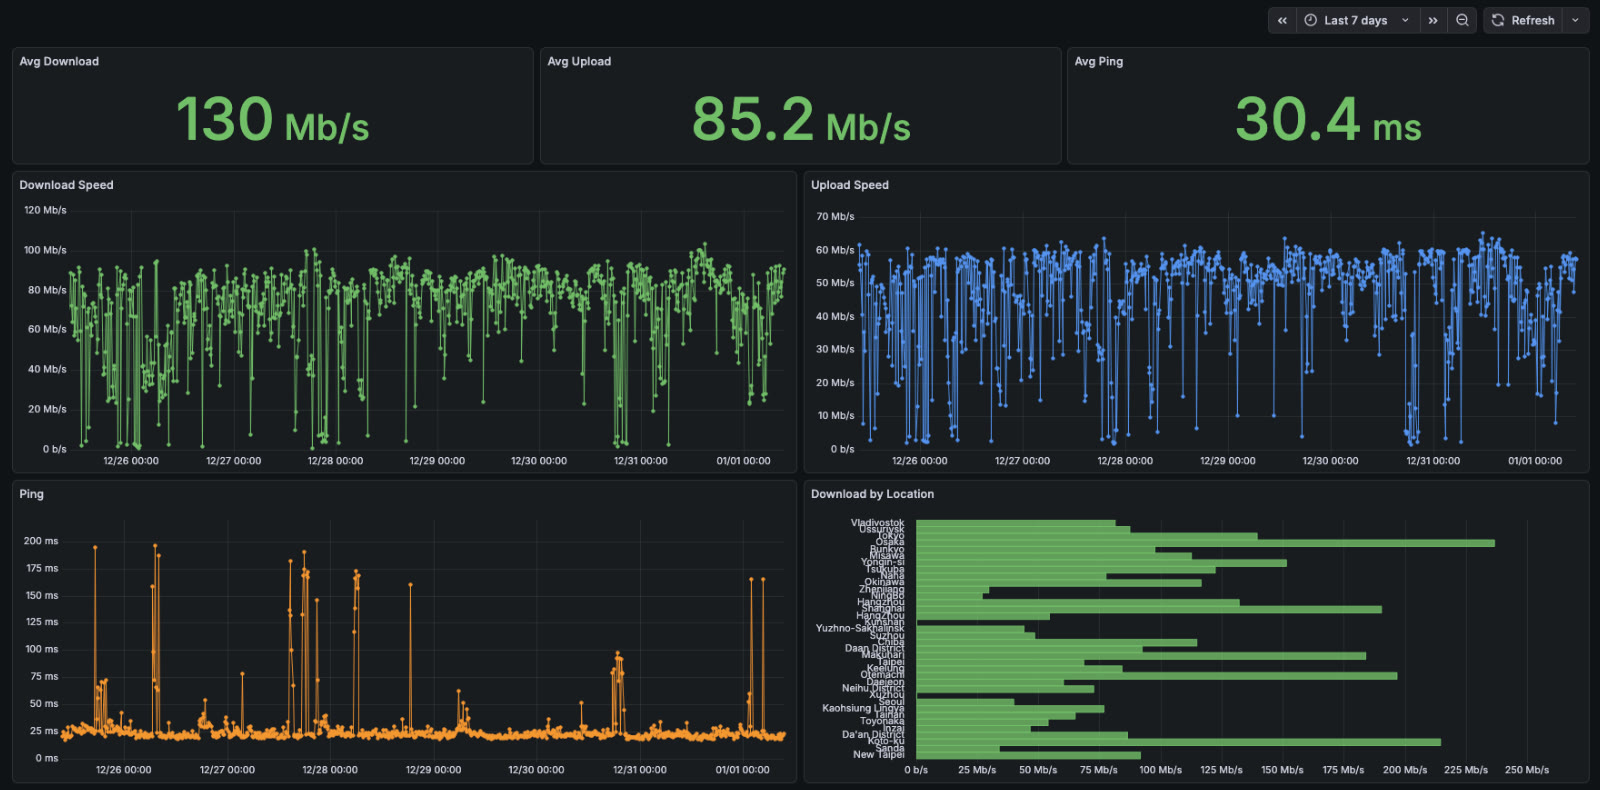
Internet Speed Tracker runs a speed test from a Mac every 10 minutes, appends the result to a CSV file, and shows the results in a Grafana dashboard: average download, upload and ping, each over time, and the average download speed for each test server. It is a personal setup built on Wolfgang Huber’s speedtest scripts and is not published as a package.
Running the test
The test is speedtest-cli, a command-line client for
Speedtest.net, installed with Homebrew. A cron job runs a shell script at 5, 15, 25, 35, 45 and 55 minutes
past every hour. The script runs speedtest-cli --csv and appends the output as one line to a
CSV file named after the computer. Each line has the server ID, the server’s sponsor, the server’s
location, a timestamp, the distance to the server, ping in milliseconds, and download and upload speeds in
bits per second.
If a test fails and speedtest-cli returns nothing, the script still writes a line with the current time and NA in every other column, so outages show up in the file as rows of NA.
Changes to the original script
The script comes from wolfganghuber/speedtest,
which suggests running it every 5 minutes from cron and plots the results with R and ggplot2. This setup
runs it every 10 minutes, calls speedtest-cli by its full Homebrew path so it works under cron, and logs
each run and its exit code to cron.log. It also rewrites the timestamp: newer versions of
speedtest-cli write times ending in +00:00Z, which Grafana’s CSV data source can’t read as a
time, so the script changes them to end in Z.
The dashboard
Grafana reads the CSV file directly with the CSV data source plugin
(marcusolsson-csv-datasource), from a read-only mount into its container. The file has no
header row, so each panel renames the columns and drops the NA rows before converting the values to
numbers. The dashboard opens on the last 7 days.
- Avg Download and Avg Upload are the mean speeds for the selected range, red below 10 Mb/s, yellow from 10 Mb/s and green from 30 Mb/s.
- Avg Ping is the mean ping, green below 50 ms, yellow from 50 ms and red from 100 ms.
- Download Speed, Upload Speed and Ping plot every test as a point over time.
- Download by Location groups the tests by the server’s location and shows the mean download speed for each one.
A small alerter reads the last line of the CSV file once an hour. If no new line has been written for 48 hours, it sends a push notification through ntfy, and it sends another when lines start arriving again. Because a failed test still writes a line, this only fires when the cron job itself has stopped.
More self-hosted
All self-hosted →