Screen Time Tracker
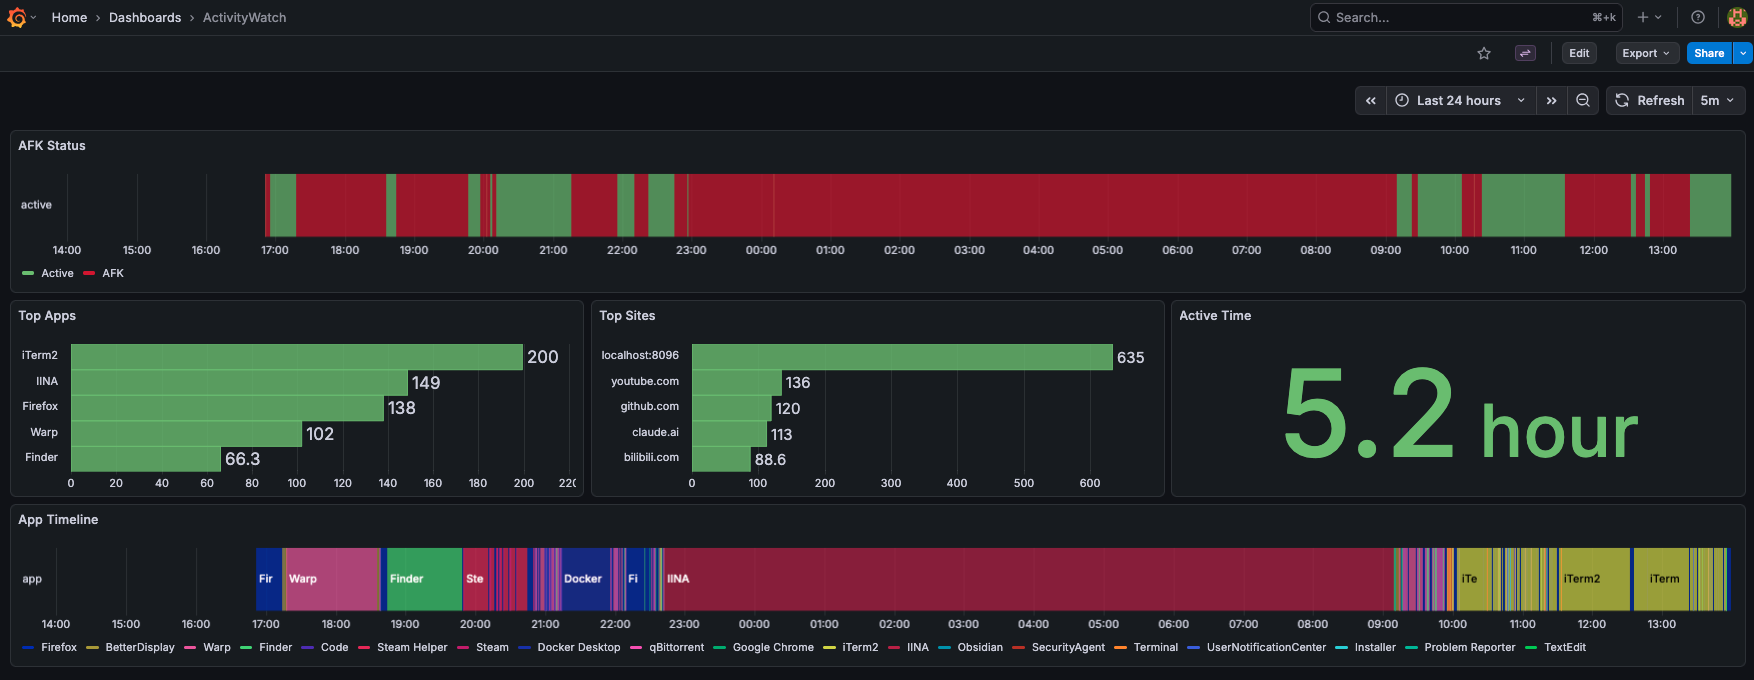
Grafana dashboard for visualizing ActivityWatch data. Tracks app usage, AFK status, and browser activity.
Architecture
ActivityWatch app records events
↓
SQLite backup via
sqlite3 .backup↓
Grafana via SQLite datasource plugin
↓
Dashboard
Panels
AFK Status (state-timeline)
SELECT strftime('%s', timestamp) as time,
  CASE WHEN json_extract(datastr, '$.status') = 'not-afk'
    THEN 1 ELSE 0 END as active
FROM eventmodel WHERE bucket_id = 6
Green = active, red = AFK. Uses value mapping for colors.
Top Apps / Top Sites (bar charts)
SELECT json_extract(datastr, '$.app') as app,
  SUM(duration)/60.0 as minutes
FROM eventmodel WHERE bucket_id = 5
GROUP BY app ORDER BY minutes DESC LIMIT 5
Top 5 apps/sites by duration. Sites extracted from URL field, strips protocol and www.
App Timeline (state-timeline)
"enumConfig": {
  "text": ["Chrome", "Code", "Terminal", ...]
  "color": ["#1934e5", "#e0c351", ...]          // auto-generated
}
Each app gets a unique color. But how?
Auto-coloring apps
Grafana's state-timeline doesn't auto-assign colors to string values (#38806, open since 2021). With hundreds of apps, manual configuration isn't practical.
Solution: Python script generates colors at container startup before Grafana loads.
docker compose up↓
enum-generator runs once (queries DB → generates colors → writes JSON)
↓
Grafana starts (
depends_on: service_completed_successfully)def hash_to_color(name):
h = int(hashlib.md5(name.encode()).hexdigest(), 16)
hue = (h * 137.508) % 360 # golden angle for max spread
# ... HSL to RGB conversion
return f"#{r:02x}{g:02x}{b:02x}"Golden angle (137.5°) ensures consecutive apps get maximally different hues.