F2 Points Calculator
F2 Points Calculator lets you predict Formula 2 races and see how they change the championship. You drag drivers into finishing positions for qualifying, the sprint and the feature race, and the drivers’ and teams’ standings update straight away. Every season since 2017 is included, with the real results filled in.
Free to use, no account needed.
Why use it
It covers every Formula 2 season since 2017 with the real results filled in, and scores the whole weekend: pole, the sprint, the feature race and fastest laps. Shortened races and the 2021 format, with two sprints a round, are scored the way they were at the time.
The current season updates itself a few hours after each race. It is free and needs no account.
Predict each round
The drivers for the season are listed as cards at the top, coloured by team. Below them is a grid with one column for each session and one row for each position. Each round has columns for qualifying, the sprint and the feature race. Sessions that have already happened show the official results, and the Results button shows or hides them.
To predict a result, drag a driver onto a position. In the current rules:
- Qualifying: 2 points for pole position.
- Sprint race: 10-8-6-5-4-3-2-1 for the top eight.
- Feature race: 25-18-15-12-10-8-6-4-2-1 for the top ten.
- Fastest lap: 1 point in each race, for a driver in the top ten.
Fill the grid faster
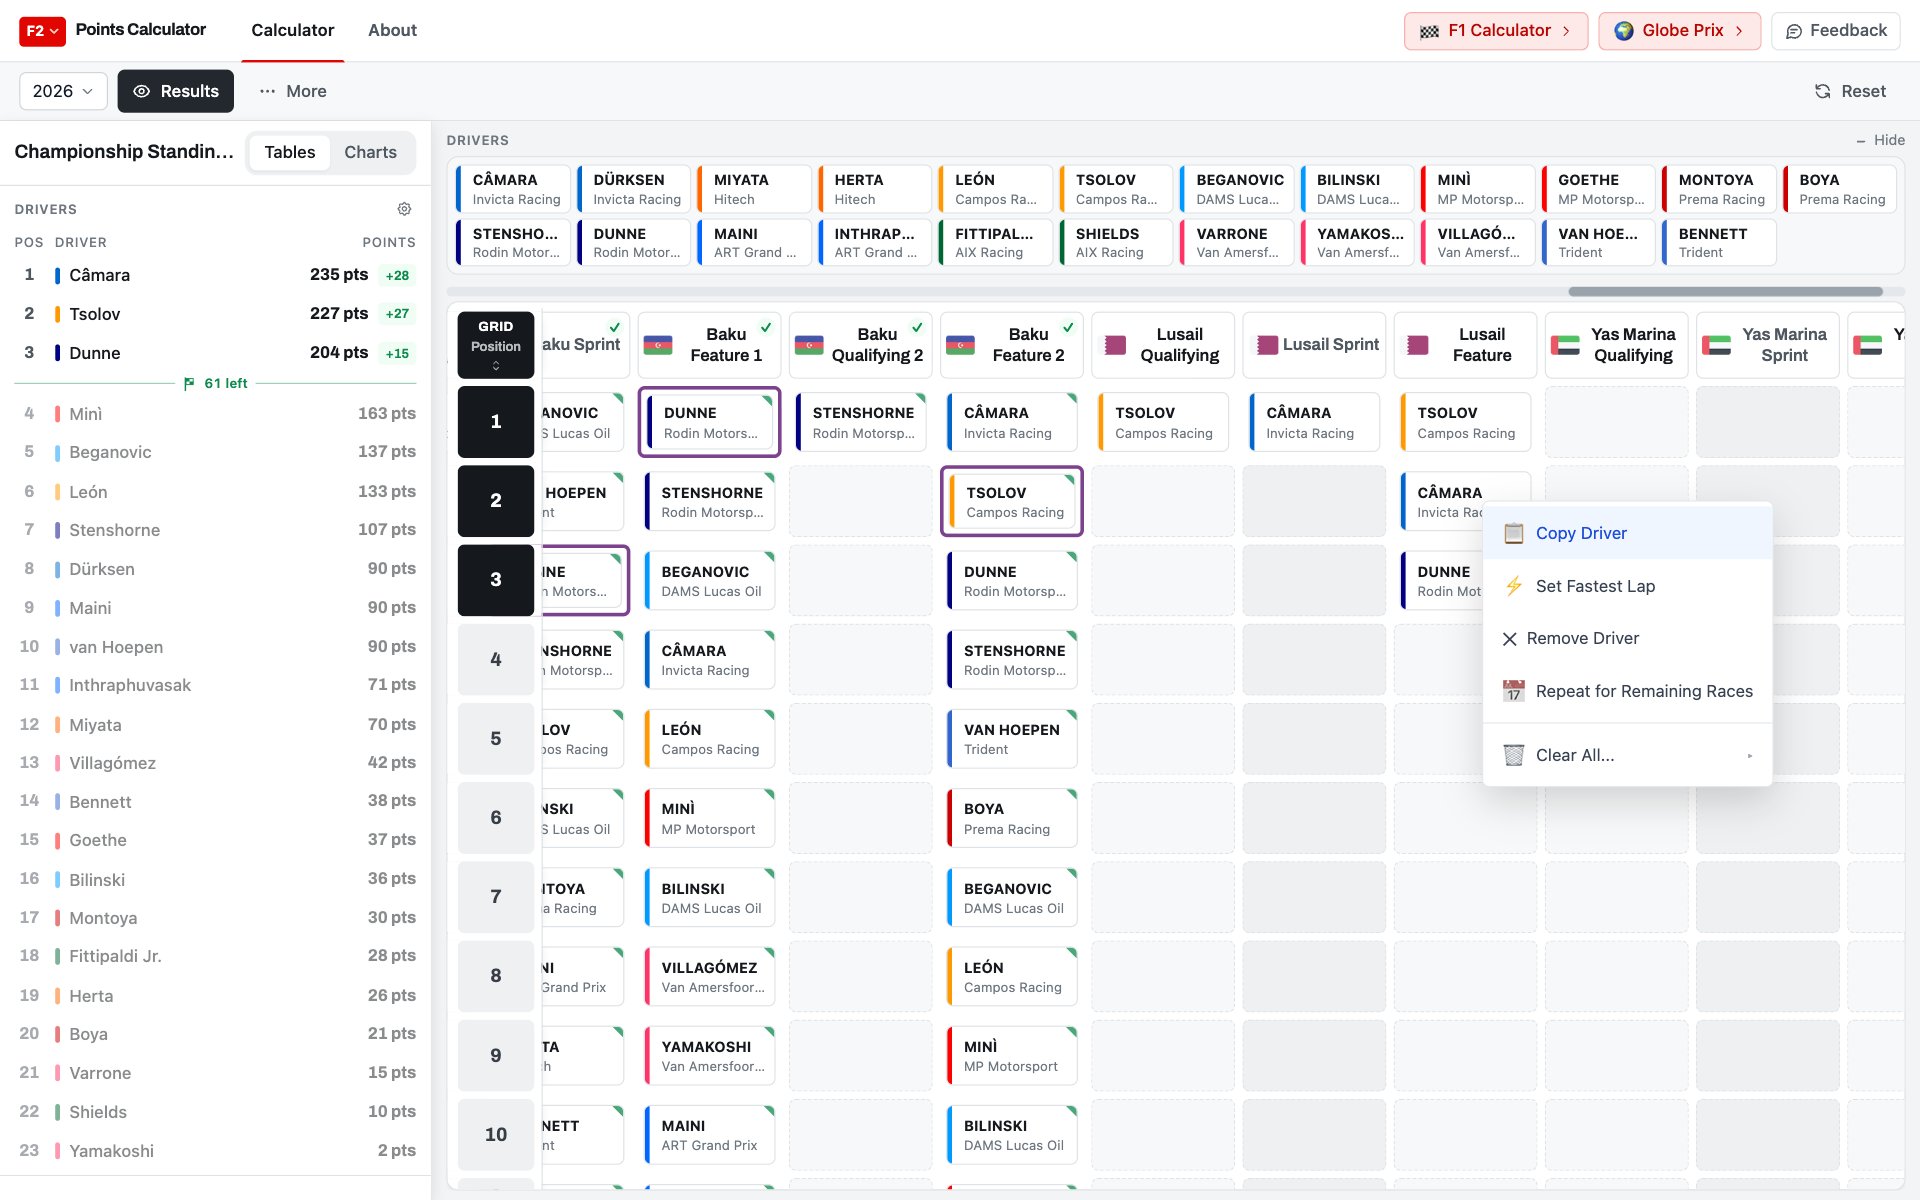
Right-clicking a driver you have placed opens a menu to copy them, give them the fastest lap, remove them, or repeat them in the same position for every remaining race of the season. Clear All removes your predictions, and Reset does the same from the toolbar.
Standings and charts
The drivers’ and teams’ standings are on the left and update after every change. The points each driver gained from the session you edited are shown next to their total. A line in the drivers’ table separates the drivers who can still win the title from those who can’t, with the number of points left in the season.
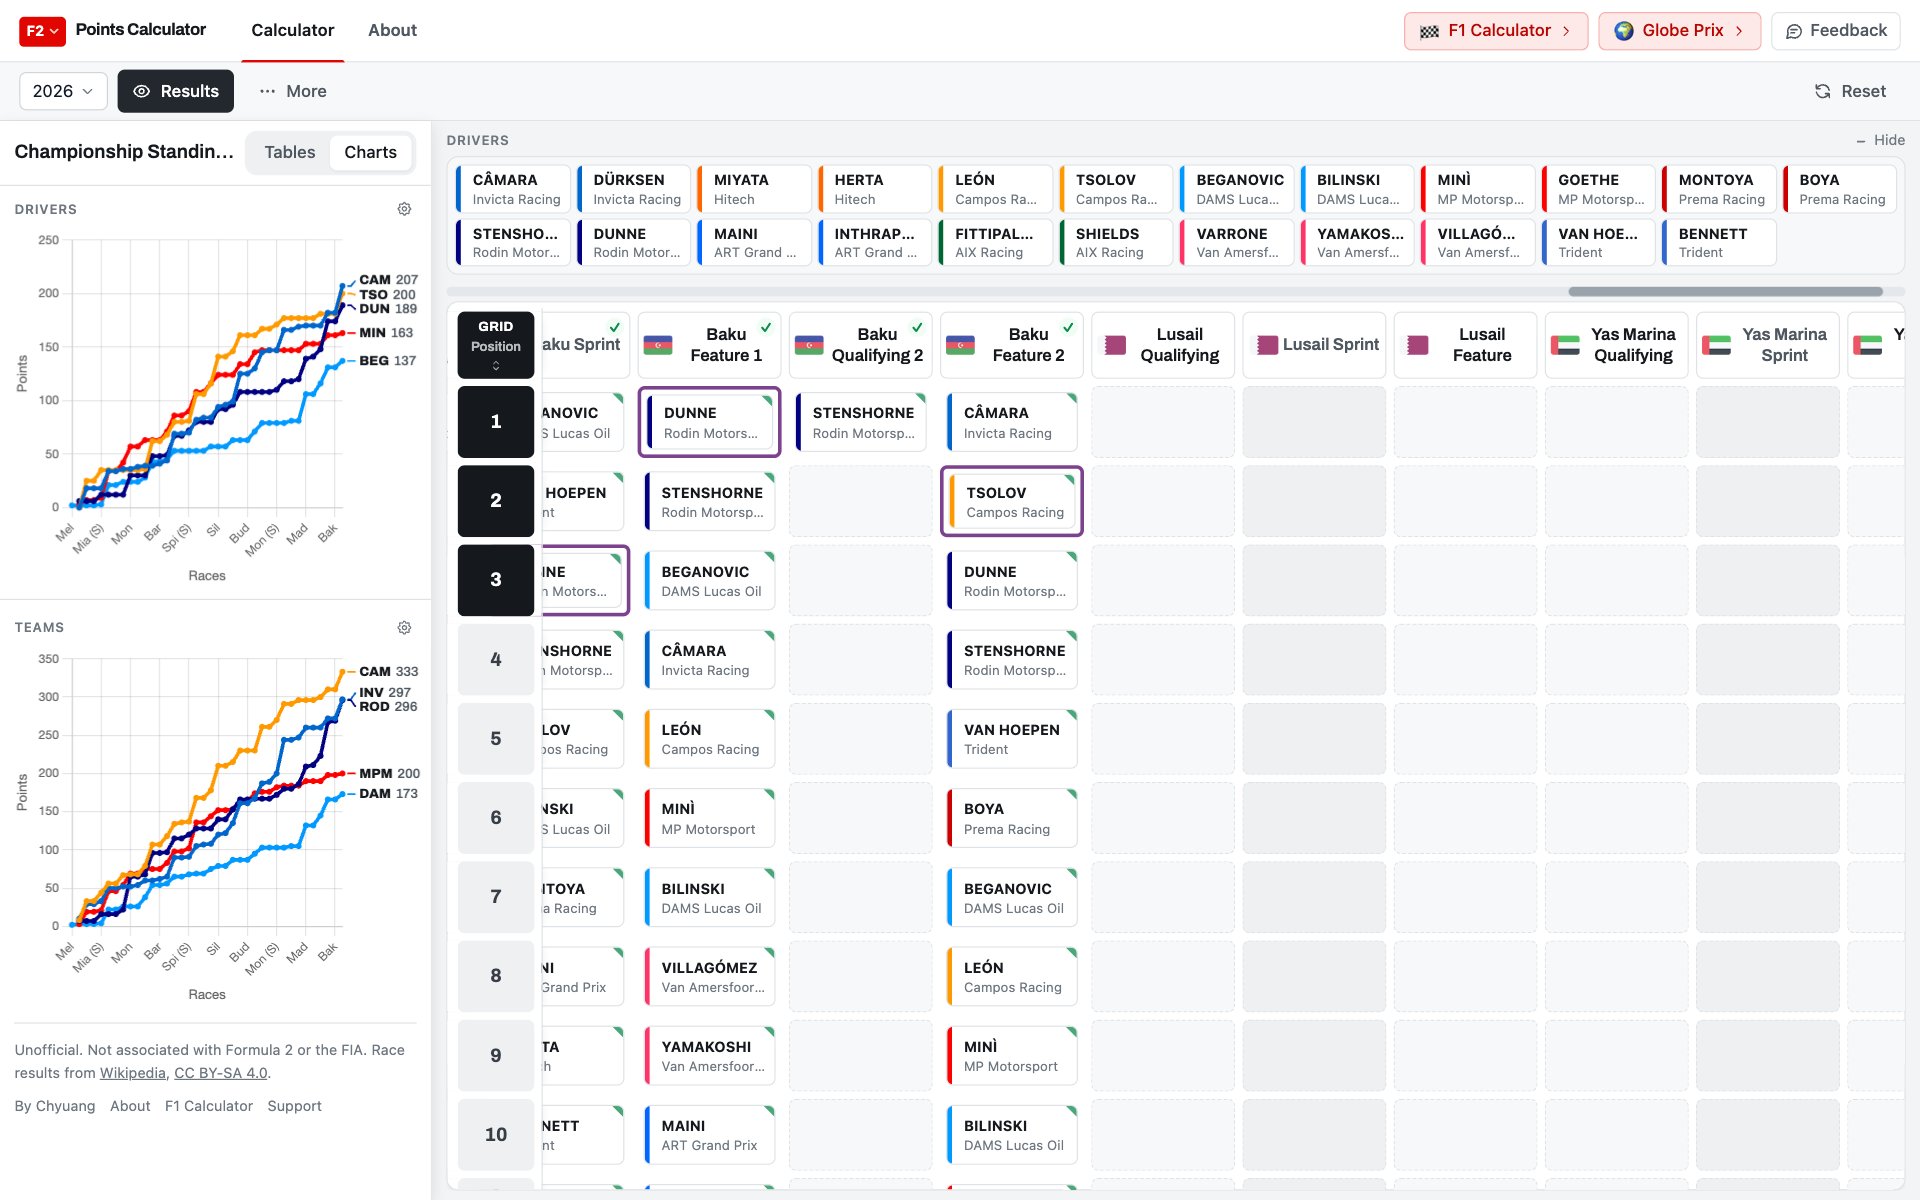
The Charts tab shows each driver’s and each team’s points total after every race.
Past seasons
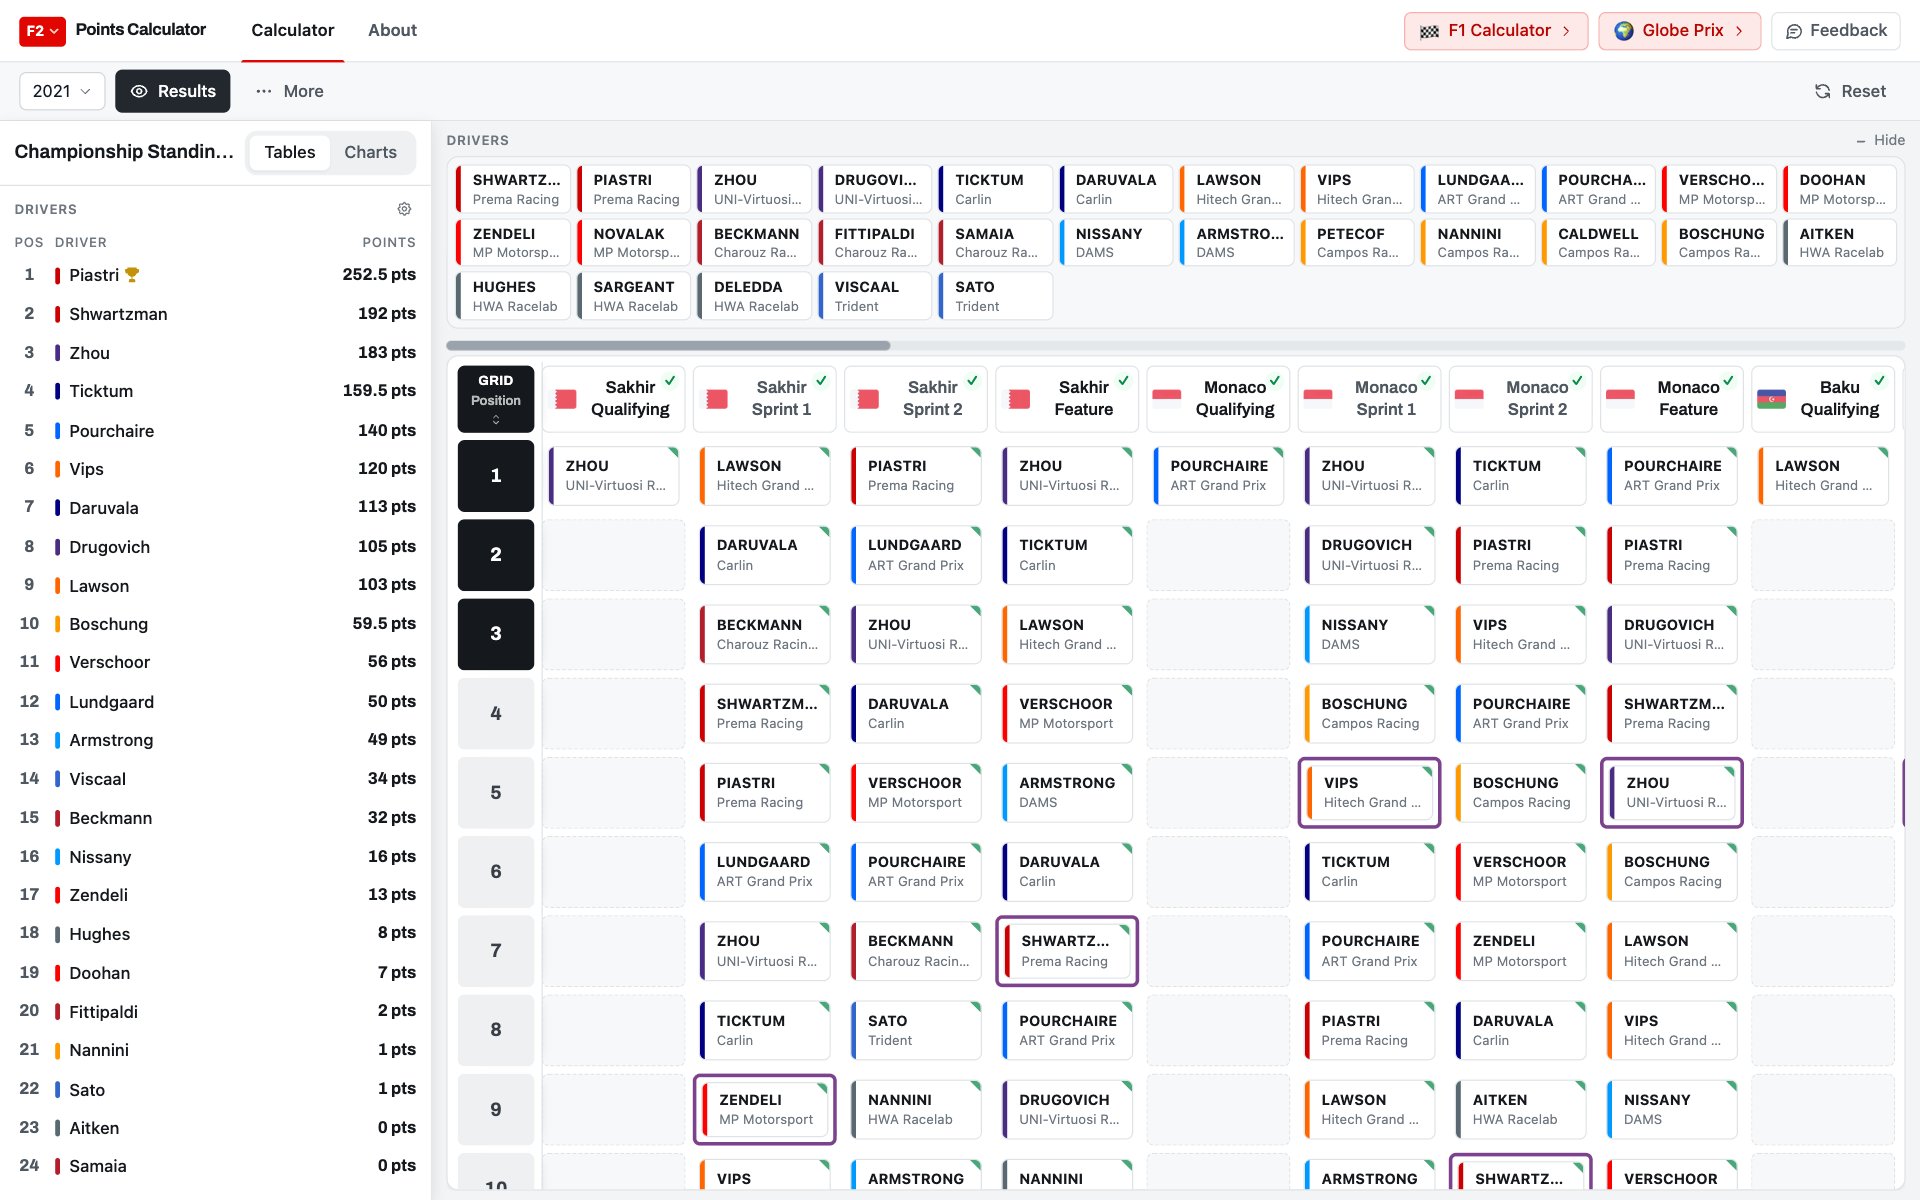
The season menu opens any year from 2017. Each season is scored with its own rules: from 2017 to 2021 the sprint paid 15-12-10-8-6-4-2-1, pole was worth 4 points and the fastest lap 2. In 2021 each round had two sprints and one feature race.
Shortened races pay reduced points, and a race stopped too early pays none. Those races carry a note on their column header. That is why Piastri’s 2021 title-winning total is 252.5 points.
Where the results come from
Results come from Wikipedia’s season pages. During the season, the calculator rereads the page every few hours, recomputes every driver’s total, and publishes the new results only if they match Wikipedia’s.
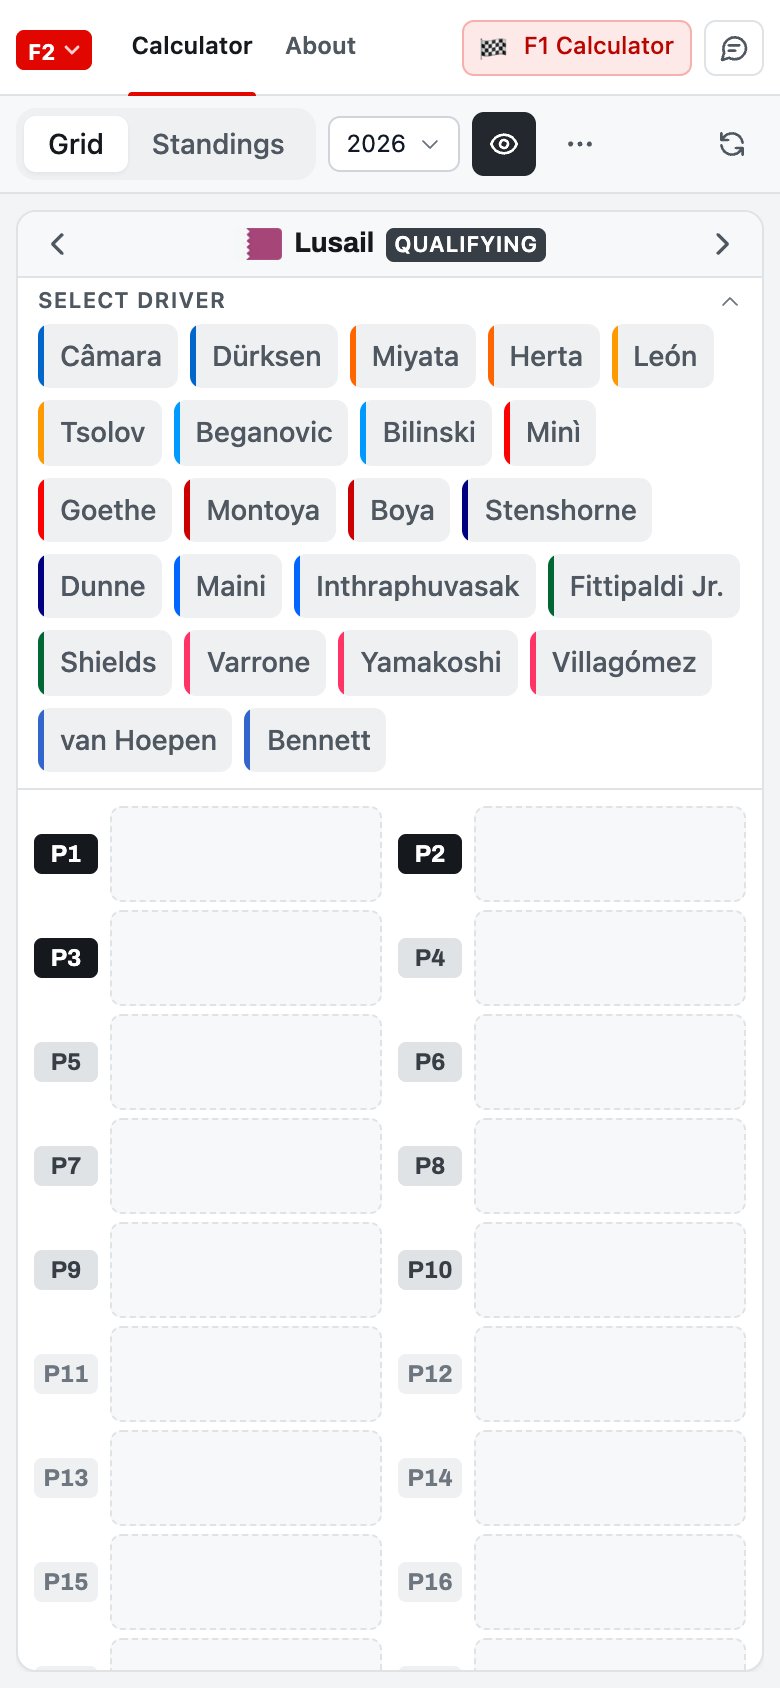
On a phone
On a phone, the calculator shows one session at a time. The drivers are listed at the top and the positions below them, in two columns. The arrows beside the session name move between sessions, and the Grid and Standings tabs switch between predicting and viewing the table.
More racing
All racing →